Inspiration
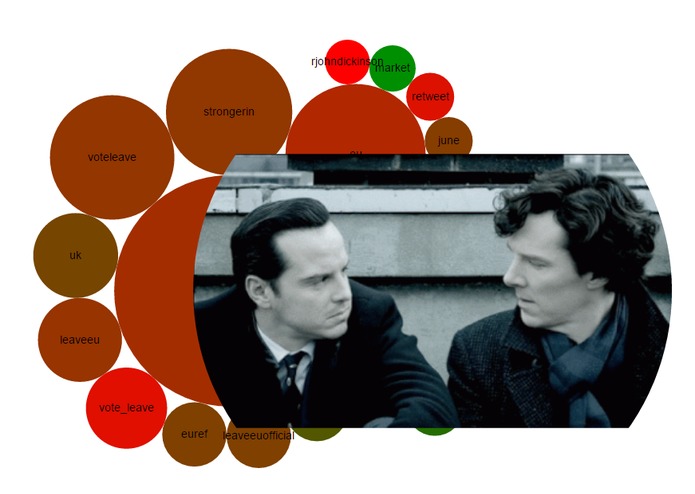
We wanted to build a system that could process a large, difficult dataset into an interesting, human readable visualisation. Also, gifs.
What it does
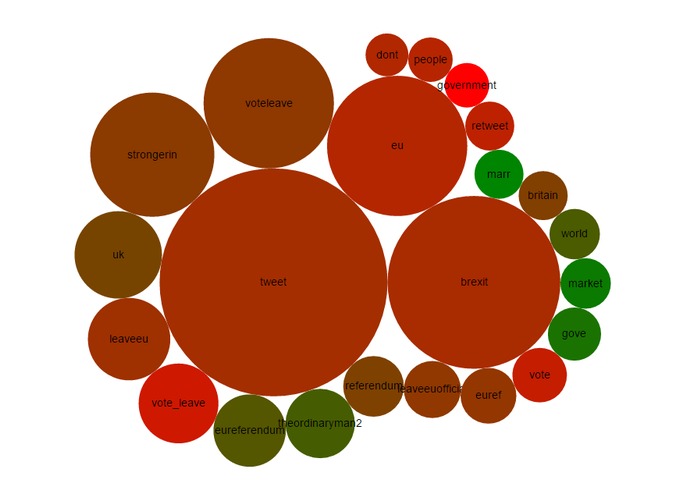
Collects tweets from the Twitter streaming API based on a set of keywords. Extracts keywords and sentiment scores the collected tweets. The last ten minutes of data is sent to the front end visualisation. We then add gifs.
How we built it
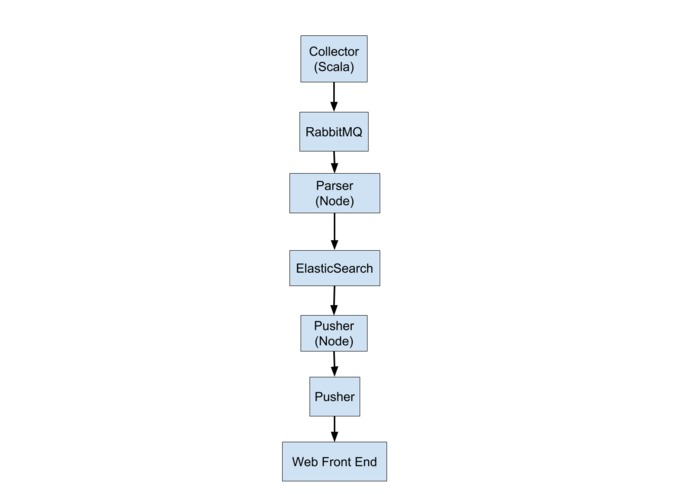
The back end is written in Node and Scala. The major technologies we used for the back end were Docker, Elasticsearch and RabbitMQ. The front end visualisation is powered by the JavaScript library d3. See attached image for more info.
Challenges we ran into
Docker.
Accomplishments that we’re proud of
Implementing CI/CD for a micro service system.
What we learned
If you’re using Docker to deploy, you need to be able to run your app locally in the Docker container it will be deployed to.
What’s next for GiffaTweet
The ability to set up multiple keywords sets, and be able to differentiate between the data extracted from each set.
Extra: Tone Parser
A second parsing process that uses the IBM Waston API to extract emotion (tone) from tweets. The data is saved in ElasticSearch, although we didn’t have time to make a front end visualisation using this data.
Tone Parser Source: https://github.com/anvilCity/tone-parser
Github
GiffaTweet
http://giffatweet.s3-website-eu-west-1.amazonaws.com/
Share this Post